Georgi Todorov
ORCID iD: 0000-0002-2381-7449
Web of Science Researcher ID: KGM-1519-2024
Technical University of Sofia, Bulgaria
Konstantin Kamberov
ORCID iD: 0000-0001-7985-2609
Web of Science Researcher ID: L-6543-2017
Technical University of Sofia, Bulgaria
Yavor Sofronov
ORCID iD: 0000-0001-9056-6056
Web of Science Researcher ID: Y-3272-2018
Technical University of Sofia, Bulgaria
https://doi.org/10.53656/adpe-2025.20
Pages 229-239
Abstract. This study presents an approach used in the design improvement of a high-temperature test fixture. The approach unites virtual and physical techniques to assess the structure after its preliminary design and first physical tests. Virtual prototyping is used to detect the possibilities of design improvement to meet the imposed requirements of the test. Performed simulations, using the virtual prototype, at that product development stage, allows for assessing various design parameters at a high level of confidence. The testing of a physical prototype is used to validate simulation results. The presented methodology is demonstrated in an industrial use case for high-temperature test fixture application. The main contribution of this study is related to the way the combination of virtual and physical prototyping and testing at different product development stages applies to the development of industrial fixtures and other similar products.
Keywords: virtual prototyping; physical prototyping; high temperature device; test fixture; vibrations; dynamics
- Introduction
Present automated manufacturing processes involve various tools and equipment that have been evolved in parallel with the automation itself. In other hand, the quality control and testing is an important component of the industrial systems, needed to respond to the global market requirements. Product testing requires devices used to consistently perform planned tests – fixtures – in different shapes, sizes, and functions, used to guarantee the stability of the tested sample. Fixtures are devices designed to locate the device under test (DUT) in a certain position and orientation, and securely hold it in that location throughout the testing (Papastathis, et al., 2012).
Their design should be adequate to the test conditions and DUT specifics (Nandy, et al., 2024) (Reddy & Hamsini, 2016), and it is highly depending on the proper standard. A sample configuration of testing is shown in Figure 1.
There are different standards for what a DUT should be able to withstand, often depending on the intended use.
One of the most typical tests is when the DUT is subjected to vibrations. Usually, these tests are conducted using an electro-dynamic shaker, where the DUT has to be properly mounted on the vibrating table using a test fixture. It presents the interface between the DUT and the shaker. This requires the fixture to be more stiff and rigid than the tested component. The way in which a DUT is mounted during a vibration test can make the difference between the component passing or failing a test. The way it is mounted should neither add nor subtract energy from the applied test (Peng, et al., 2023), and it is of primary importance that the fixture does not modify the dynamic behavior of the DUT (Poncelet, et al., 2005). The test fixture could be subjected to high amplitudes in the test range due to its mass/stiffness characteristics, when the resonant frequencies causes significant problems to the DUT during vibration testing (Reddy & Reddy, 2010), (Venkat, et al., 2016).
This issue could occur if the fixture influences the test. It is a negative effect that usually is avoided, but it could appear in engineering practice. Low resonance frequency of the fixture may lead to atypical behavior and results for the product and needs to be fixed (Takeshita, et al., 2022). The problem that needs solution is how to avoid fixture’s influence over tested product. The answer could be difficult and could result in multiple experiments, especially when there is no clear vision about outgoing processes (Lloveras et al., 2022).
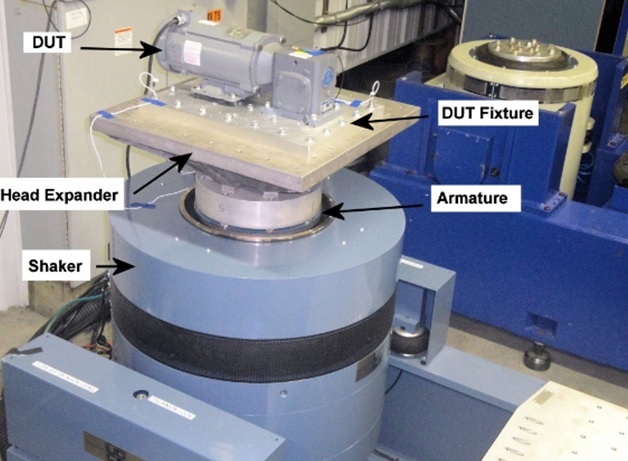
Figure 1. Example of a DUT at vibration testing with shaker
А way of reaching a successive solution is to use virtual prototyping (VP). It could be defined as “A computer-based simulation of a system or subsystem with a degree of functional realism comparable to a physical prototype” or as “The process of using a virtual prototype, in lieu of a physical prototype, for test and evaluation of specific characteristics of a candidate design” (Schaaf & Thompson, 1997). The VP introduces new approaches to engineering activities such as to predict and to prevent errors and reduce the number of physical prototypes (PP) or even to eliminate them (Todorov & Kamberov, 2020), (Nedelchev, et al., 2021). It also allows performing optimization of parameters (Malakov & Zaharinov, 2016), (Hinov & Gilev, 2023) and understanding in higher level of detail the physics-of-failure.
This study aims to demonstrate an approach to detect and evaluate critical for design performance parameters of a high temperature test fixture. It also demonstrates how existing in practice issue could be overwhelm, using the ability of the VP to assess hard to measure internal parameters as dynamic ones of a system.
- Approach for dynamic behavior improvement of a test fixture
The developed approach is based on virtual prototyping application. It is targeted to assess the potential reason for failure/malfunction by presenting a hypothesis and further detailed examination of ongoing physical process. Its general overview is presented in Figure 2.
This approach uses 8 steps to reach an applicable test fixture realization. It starts with:
- Preliminary physical testing, overview and hypothesis development – the first and probably most important step is to review the current status of the fixture. It begins with physical testing and analysis of obtained results, aiming to develop a hypothesis for the reason of the issues. It should result in a viable plan for further development of the project.
- Physics characterization and analysis planning – once the hypothesis is defined, next is to examine in detail the physics of the ongoing process as to define boundary conditions and to plan the engineering analysis. This step is a basis for further definition of the simulation model.
- Virtual prototype generation – includes geometry preparation (possible clean-up), material models definition, mesh structure development and overall preparation for simulation.
- Simulation and results analysis – using the developed VP and predefined analysis type, simulation is run. Obtained results should be carefully examined as to define the major specifics and to evaluate the physics of failure/malfunction. Final results should be formulated as recommendations and plans for further design improvement.
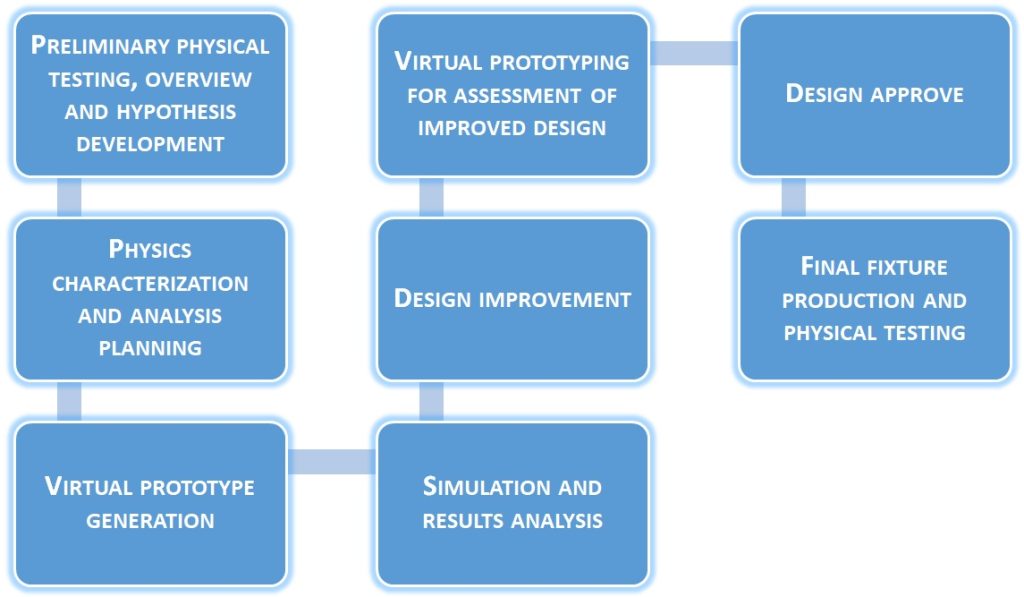
Figure 2. Approach for test fixture performance improvement
- Design improvement – the design improvement is based on obtained simulation results, paying attention to possible production technologies and their specifics. It results in prepared for technical documentation virtual prototype of a design iteration to reach improved performance and to meet the requirements for the test fixture performance.
- Virtual prototyping for assessment of improved design – this step repeats performed simulation over the initial design. It aims to assess the improvement and the efficiency of the proposed design changes.
- Final design approve – a summary of performed modifications and the results analysis of the improved design. The step would result in approval for manufacturing of the improved design.
- Final fixture production and physical testing – this is the final step that aims to validate design changes and to finish with ready for exploitation test fixture.
- Approach approbation in an industrial case
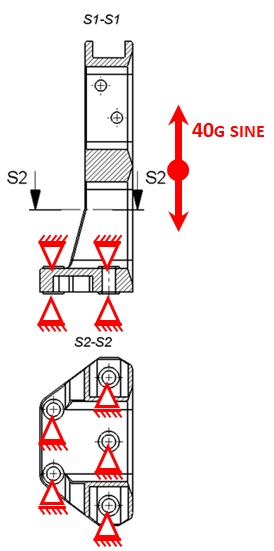
Examined fixture is mounted on the armature of a shaker, equipped with two accelerometers for shaker control. The fixture has 4 positions for sensors mounting. It is shown in general on Figure 3 а).
3.1. Preliminary physical testing, overview and hypothesis development
Performed tests show that there are resonances of shaker armature with fixture at frequencies that are slightly influenced by position of control accelerometer. It is observed that there are very significant resonances are around 3570 Hz. Another conclusion of performed tests shows that on all fixture positions measurements of monitoring accelerometer at resonances above 3500 Hz exceed the usual limits of +/- 6 Db.
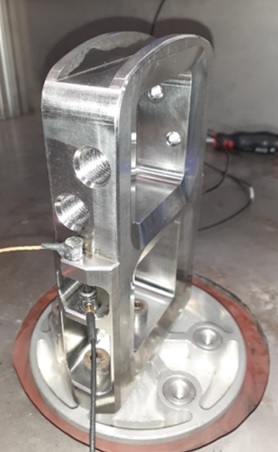
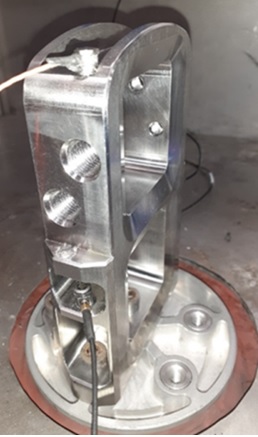
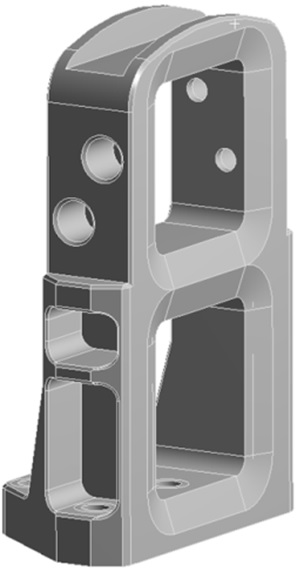
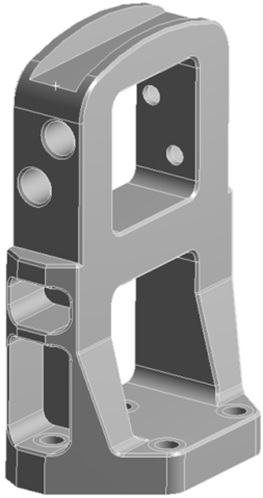
а) Initial design of test fixture b) Geometry model
Figure 3. Examined test fixture – physical prototype and geometry model
3.2. Physical characterization and analysis planning
Detailed review leads to the conclusion that the design has not sufficient index of rigidity versus mass and it results in natural frequency that is in the test range.
The design needs to be decreased as mass and increased as rigidity. This requires also specific materials as to withstand high temperature of over 800ºC.
Current design needs to be assessed by modal analysis that will show the natural frequencies distribution over examined frequency range. Also, natural modes will give sufficient information for the direction of design improvement. Analysis planning should be related with further development of a new, improved design and its evaluation using the same tools that are used for the preliminary design evaluation.
3.3. Virtual prototype generation. Simulation and results analysis
There is no need to simplify the fixture model geometry, as it is not overly complex and the 3D model is used as is for the analysis. Bolted connections to the armature are presented by imprints of bolts to the fixture and thus are not included in the model. Used for simulations geometry model is shown in Figure 3 b).
Material data, used for simulation, is based on mechanical parameters for Inconel 625 – widely used material for devices that cope with high temperatures. It has the next main parameters:
- Young modulus: E = 205.8 GPa
- Density: ρ = 8440 kg/m3
- Poisson’s coefficient: μ = 0.315
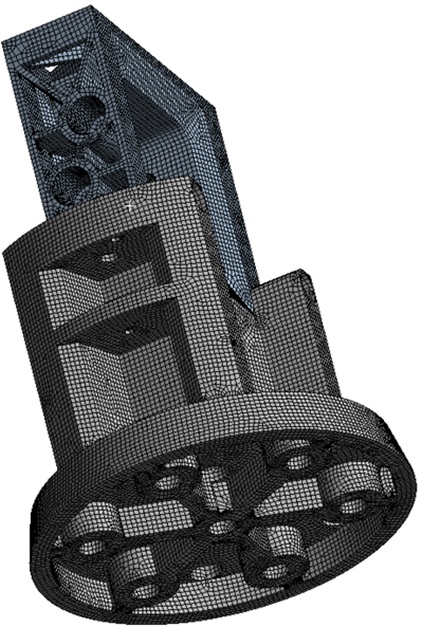
Mesh model is generated using 3D hexagonal elements (without midside nodes). General simulation mesh parameters are 89 200 nodes and 107 800 elements in total. It is presented on Figure 4 a) as general view.
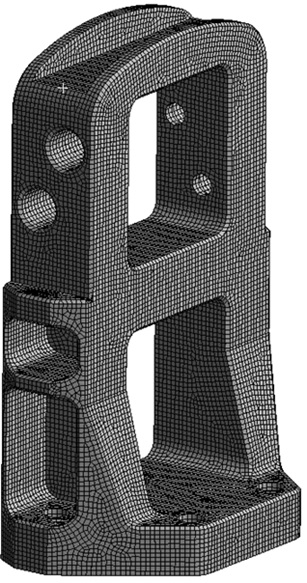
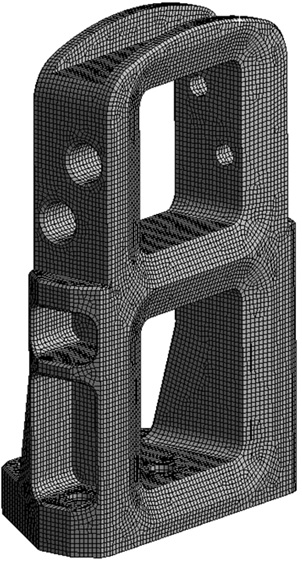
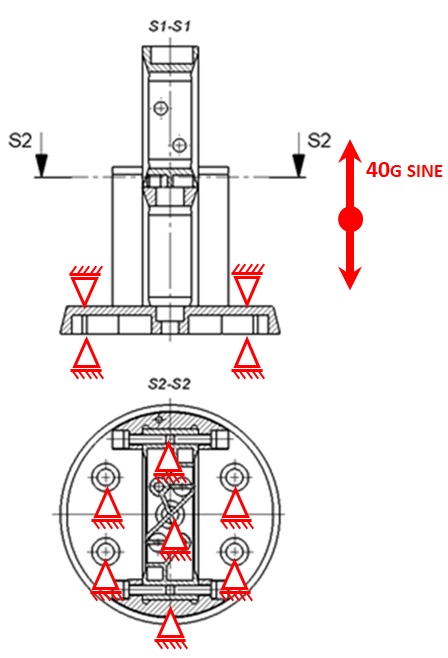
а) Mesh model b) Applied boundary conditions
Figure 4. Simulation model: mesh and applied boundary conditions
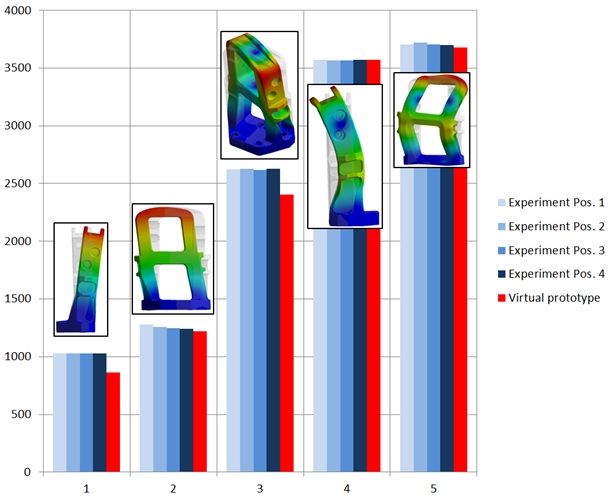
Figure 5. Simulation results and comparison against measured over physical prototype data
The model is constrained as it is shown on Figure 4 b). Vertical direction is constrained on the both top down and top contact surfaces as to represent mounting to the armature. Sine profile from 100Hz to 5000Hz at 40g was used for validation of the fixture – as it is used for experimental tests.
First five natural mode shapes and frequencies are calculated through modal analysis simulation. Obtained results are shown on Figure 5 graphically and it shows slight differences to measured frequencies. It is important to note that the 4th mode is nearly same as measured value as the calculated value is 3570 Hz.
These results show that there is sufficient correspondence between simulation model (virtual prototype) and physical prototype.
Obtained results are examined in detail and next conclusions are formed:
- There are high acceleration amplitudes at 3570Hz, which mode has deformations of rotation about transverse axis (refer to Figure 5);
- Mass of the examined design is relatively high – 1.724 kg. This leads to decreased natural frequency of the assembly fixture – armature of shaker.
- Improvement of structure rigidity is needed, together with decrease in the mass, as to reach higher natural frequencies.
3.4. Design improvement
Influence over this mode has the local rigidity of the structure at its cross section that needs to be strengthened. Also, the fixture is asymmetric and has no full contact to the armature of the shaker that decreases contact stiffness. Proposed new design is two components, multi-material – top frame (TF) is to be produced by Inconel or stainless steel and bottom part (BP) – of aluminum alloy (7075). Its design is shown on Figure 6.
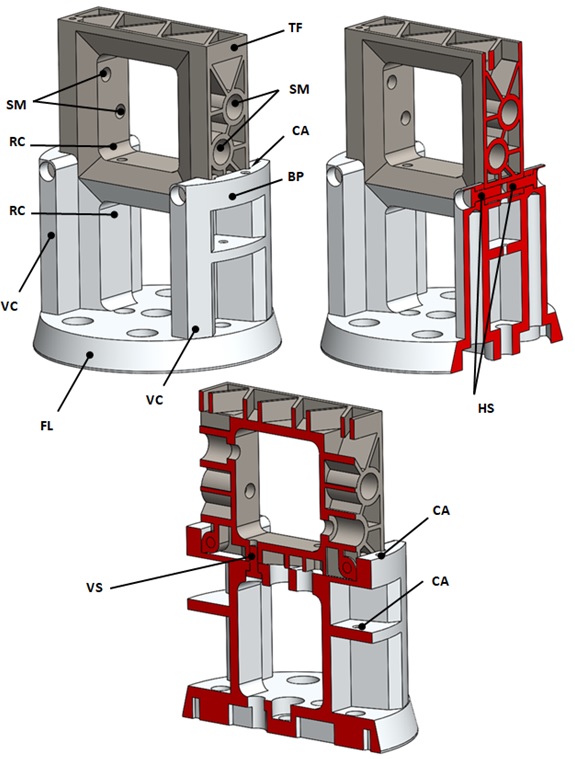
Figure 6. Improved design
All components are decreased by mass and are planned to be produced by milling. The connection between both components is by screws, as it is shown on Figure 4.1. Four screws (HS) are mounted in plane, connecting side columns, and two additional screws (VS) – in vertical direction. Top frame is slotted in special cavities (CA) on both sides of bottom part – to increase contact stiffness.
A flange (FL) is formed – to contact closely to the shaker’s armature and to increase contact stiffness. Also, the design of bottom part is symmetric, with enlarged vertical columns (VC) – to increase flexural stability.
All functional interfaces and design space are kept (marked on Figure 6):
- two rectangular cuts with fillets (RC);
- 2 holes for tested sensors mounting (SM) on each side;
- 4 holes for control accelerometer (CA) mounting in total.
Overall weight of this structure is approximately 1kg.
3.5. Virtual prototyping for assessment of improved design. Final design recommendations, production and physical testing
Mesh model is generated using 3D hexagonal elements (without midside nodes). General simulation mesh parameters are 153 400 nodes and 191 100 elements in total. It is presented on Figure 7 a) as general view. The model is constrained as it is shown on Figure 7 b). Vertical direction is constrained on the both top down and top contact surfaces as to represent mounting to the armature – by 7 bolted connections. Sine profile from 100Hz to 5000Hz at 40g was used for validation of the fixture – as it is used for experimental tests.
а) Mesh model b) Applied boundary conditions
Figure 7. Simulation model of improved design: mesh and applied boundary conditions
Material data, used for simulation, is based on general mechanical parameters for stainless steel and for aluminum alloy and are not listed in detail here.
First five natural mode shapes and frequencies are calculated through modal analysis simulation. Obtained results are shown on Figure 8 graphically and it shows the comparison of the initial versus improved design of the fixture.
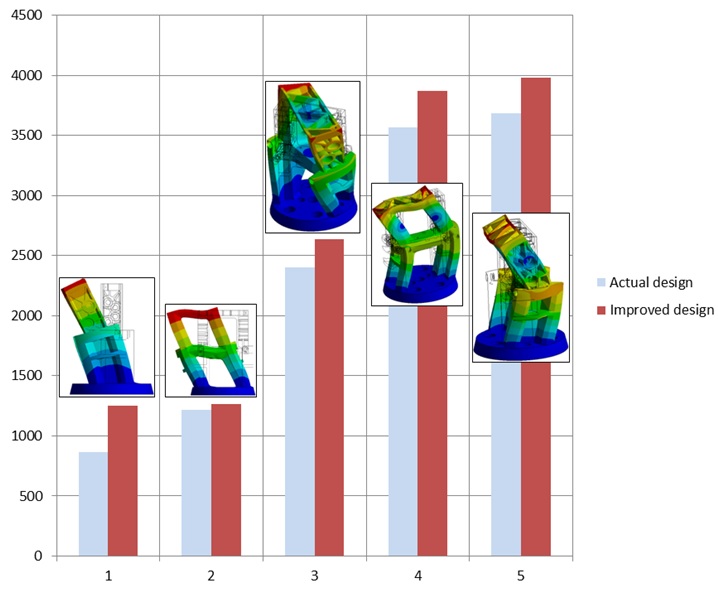
Figure 8. Modal analysis results of improved design: Comparison between actual and improved designs, based on virtual prototyping results (presented by their natural mode shapes too)
These results shows that there is certain improvement of dynamic behavior of newly proposed design as its natural frequencies are higher as values when compared to initial design.
Two important resonances – 3872Hz and 3979Hz – are visible, but acceleration does not reach 650 m/s2, or 66g. This value is THREE times less than acceleration for initial, actual design.
Conclusions
The proposed approach for the improvement of a high temperature test fixture is validated through an industrial case. This approach consists of eight steps and combines the advantages of both virtual and physical prototyping. Virtual prototyping and simulations enablethe evaluation and verification of the of key parameters, such as dimensions, material selection, and the overall design concept of the fixture. It is important to note the strong correlation between simulation-based virtual prototype calculations measured and the measured values from the physical prototype.
The presented use case study successfully demonstrates the effectiveness of the developed approach, which has been implemented within an industrial setting. Future applications of this approach are particularly promising for the development of new test fixture designs, including those of different types. By combining virtual and physical prototyping, this method provides a well-balanced and efficient solution for industrial applications.
Acknowledgement
This study is financed by the European Union’s Next Generation EU through the National Recovery and Resilience Plan of the Republic of Bulgaria, project No. BG-RRP-2.004-0005.
REFERENCES
Hinov, N., Gilev, B. (2023). Design Consideration of ZVS Single-Ended Parallel Resonant DC-DC Converter, Based on Application of Optimization Techniques. Energies, 16(14), 5295. https://doi.org/10.3390/en16145295.
Lloveras, J. S., Azpurua, M. A., Pous, M., Quilez, M., Silva, F. (2022). Design and Validation of a Test Fixture for Studying RF Current Flux Through Mechanical Aircraft Joints. ESA Workshop on Aerospace EMC. https://doi.org/10.23919/AerospaceEMC54301.2022.9828829.
Malakov, I., Zaharinov, V. (2016). Optimization of size ranges of technical products. Applied Mechanics and Materials, 859, 194 – 203. https://doi.org/10.4028/www.scientific.net/AMM.859.194.
Nandy, T., Coutu, R. A., Mahbub, R. (2024). Improved Test Fixture for Collecting Microcontact Performance and Reliability Data. Micromachines, 15(5), 597. https://doi.org/10.3390/mi15050597.
Nedelchev, K., Semkov, M., Kralov, I. (2021). Geometric synthesis of fly wheel energy storage design. AIP Conference Proceedings, 2333(1), 090029. https://doi.org/10.1063/5.0045295.
Papastathis, T., Bakker, O., Ratchev, S., Popov, A. (2012). Design Methodology for Mechatronic Active Fixtures with Movable Clamps. Procedia CIRP, 3, 323 – 328. https://doi.org/10.1016/j.procir.2012.07.056.
Peng, Y. Cai, Q., Yang, L., Cao, X., Zhou, L., Li, H., Zhu, Y. (2023). Design of high-frequency test fixture considering impedance matching. Proceedings of International Conference on Mechatronic Engineering and Artificial Intelligence (MEAI 2023), 13071. https://doi.org/10.1117/12.3025450.
Poncelet, F., Marin, F., Fleury, C., Golinval, J.-C. (2005). Optimal design of fixtures for vibration testing of structures on electro-dynamic shaker. 12th International Congress on Sound and Vibration, Lisbon, 1 – 8.
Reddy, A., Hamsini, K., Petunias, H. S. (2016). Design and Development of Vibration Testing Fixtures. International Journal of Students’ Research In Technology & Management, 4(1), 8 – 11. https://doi.org/10.18510/ijsrtm.2016.413.
Reddy, T. S., Reddy, K. V. K. (2010). Design and analysis of vibration test bed fixtures for space launch vehicles. Indian Journal of Science and Technology, 3(5), 592 – 595. https://dx.doi.org/10.17485/ijst/2010/v3i5.15.
Schaaf, J. C., Thompson, F. L. (1997). System Concept Development with Virtual Prototyping. Proceedings of the 1997 Winter Simulation Conference, 941 – 947. https://doi.org/10.1145/268437.268688.
Takeshita, A., Sedillo, H., Jankowski, K., Barba, J., Bouma, A., Billingsley, E., Abdelkefi, A. (2022). Effects of test fixture connections and interference of the BARC structure on its dynamical responses. International Journal of Mechanical Sciences, 221, 107186. https://doi.org/10.1016/j.ijmecsci.2022.107186.
Todorov, G. D., Kamberov, K. H., (2020). Black box/white box hybrid method for virtual prototyping validation of multiphysics simulations and testing. IOP Conference Series: Materials Science and Engineering, 878(1), 012051. https://doi.org/10.1088/1757-899X/878/1/012051
Venkat, Varun, Singh, A. K., Srikrishna, Mudda, S., Jhorar, R. (2016). Design, Analysis and Testing of Multi-axis Vibration Fixture for Electronic Devices. Indian Journal of Science and Technology, 9(34), 1 – 7.