Oleg Milev
ORCID iD: 0009-0003-4439-0194
Trakia University of Stara Zagora, Bulgaria
https://doi.org/10.53656/igc-2024.13
Pages 118-127
Abstract. This article aims to make an analysis and evaluate the factors that influence economic profitability, which could lead to improvement of the financial state of the enterprises in the agricultural sector. The object of study is the return on assets. Known in literature as economic profitability, this factor is important because it provides information about the degree of efficiency by which enterprises exploit their resources. Focusing on the agrarian sector on the basis of selected and summarized statistical data over a period of five years we have opted for a method of studying the direct factors determining economic profitability. To define the strength and direction of change of return on assets we have measured the impact of the efficiency from using non-current assets, turnover of current assets and the influence on the changes of revenue profitability. In conclusion, we describe the main moments and results from the realized studies in this article, by outlining the inferences drawn on the basis of an analysis of the agricultural sector in Bulgaria.
Keywords: profitability; assets; return on assets; agriculture
JEL: O11, Q11, 013
- Introduction
Agricultural industry has long traditions in Bulgaria. Apparently, this is the most important branch because the produced goods serve to feed the population, and secure the production of medications, biofuels, and many other resources needed for normal human existence.
The sustainable development of agriculture is a top priority as it affects the economic, demographic and environmental policy of each country. The industry is associated with problems due to the use of outdated methods and tools, lack of innovation and low return on income, which leads to the lagging of the sector compared to EU member states (Veleva, Mondeshka & Tsvetanova, 2023).
Due to the increase in the population, farmers are forced to increase the production of agricultural products. This requires the application of modern approaches, strategies and technologies to reach the so-called precision agriculture (Petropoulos et al., 2023).
In recent years, the application of the cluster approach in the production and merchandize of grain foods has become an important instrument for the improvement of economic development in this industry and a basis for enhancing competitiveness of enterprises in the agricultural sector (Terzieva, 2023).
According to the Classification of Economic Activities, the agricultural industry with its two main branches – crop growing and livestock farming, can be allocated to Sector A “Agriculture, forestry and fisheries” (NSI, 2008, pp. 54 – 55).
The cost of the gross production by output prices in Bulgaria in 2022 amounts to 12982,2 mln BGN. Compared to the previous year of 2021, there is an increase of 2161,3 mln BGN, or 19,97%. The considerable growth resulting from this increase is due to the subindustry of crop growing, and to a lesser extent – to livestock farming. The gross added value measured by basic prices in this industry has reached 5913,2 mln BGN, with an increase of 13,53% versus the previous year (NSI, 2024).
In 2022 the agricultural goods exchange of Bulgaria reaches a growth of 42,8% on an annual basis, with a value of 14938,8 mln EUR. The export of agricultural goods during the year amounts to 8269,9 mln EUR, with 36,9% above the level of 2021. A more serious increase can be observed in imports by 50,9%. The traditionally positive balance in the agricultural trade in Bulgaria has shrunk with 1,3% on an annual basis to 1601 mln EUR. (Ministry of Agriculture and Food, 2023, pp. 60 – 68).
In economics, there are various profitability indicators, whereas the key is profitability calculated on the basis of assets. This indicator is one of the two fundamental indicators of efficiency of asset use in the total activity of the enterprise.
Return on assets is a key indicator for the efficiency of the used assets in the enterprises’ activity. It is also a criterion for the profitability of the company as a whole, because it expresses its ability to generate profit, by using available assets (Todorov, 2003, pp. 15 – 21).
- Methods
The calculation of the return on assets is made on the basis of summarized statistical data from the financial accounting reports of companies working in agriculture. This sample represents 7% of stratified information of the firms in the Bulgarian agricultural sector. For greater detail we provide an individual comparative analysis of the two main agrarian branches, namely crop growing and livestock farming. The data used cover a period of 5 years, respectively from 2017 to 2021 (Milev, 2023).
When we speak of production, and agriculture in particular, we have to determine the main concepts related to it, i.e. those assets, which have a direct link to the activity: non-current and current assets.
Following the abovementioned, the calculation of economic profitability with the profit indicator, we shall use the net (balance) profit from agricultural production, i.e. the profit from habitual activity, and for assets, respectively the sum of the assets. In economics this is also referred to as return on assets (ROA), and is expressed as a ratio between net profit (NP) and assets (A).
![]()
Equation 1. Return on assets
After obtaining the return on assets, for greater depth of the analysis we must calculate some additional indicators, related to the efficiency of the use of non-current assets, return on current assets and revenue profitability.
In economic research the coefficient of the efficient use of non-current assets (Cnca) is also known as investment absorption coefficient (capital-output ratio) and is calculated as a ratio between the non-current assets (NCA) and the total revenue size (TR) (Timchev, 1999, pp. 204 – 207).
![]()
Equation 2. Coefficient of the efficient use of non-current assets
The coefficient of the turnover of the current assets (Ctca) is calculated as a relation between the current assets (CA) and the total revenue (TR). This indicator characterizes the rate of turnover on production assets (number of turnovers).
![]()
Equation 3. Coefficient of the turnover of the current assets
The revenue profitability (RP) is calculated as a ratio between the net (balance) profit (NP) and the total revenue (TR).
![]()
Equation 4. Revenue profitability
The methodology of calculating the return on assets is borrowed from the Dupon model and through it we have studied and analyzed the influence and power of asset change considering three factors: (Chukov, 2003, pp. 221 – 235).
– Influence of the efficiency from the use of non-current assets
– Influence of the turnover of current assets
– Influence on the changes of revenue profitability
In order to determine the degree of the impact power and direction of the return on assets, we must define two conditional levels of profitability, namely: (Chukov, 2020).

Equation 5. Conditional levels of profitability
where (0) and (1) are respectively the values of the basic and current year.
The influence of efficiency from the use of non-current assets (INFnca) is calculated as a difference between the first conditional profitability and the basic return on assets.
![]()
Equation 6. Influence of non-current assets
The influence of the turnover on current assets (INFtca) is calculated as a difference between the second and the first conditional return on the assets.
![]()
Equation 7. Influence of return on current assets
The influence on the changes of revenue profitability (INFrp) is calculated as a difference between the current profitability and the second conditional return on assets.
![]()
Equation 8. Influence of revenue profitability
- Discussion of the results
The results from the return on assets for the agricultural sector have been grouped in two tables, respectively for crop growing (Table 1) and livestock farming (Table 2). The values of the main factors that influence the return on assets appear as net profit and assets. For greater detail, the absolute changes over the period have been calculated, as well as the impact of the three factors, respectively from the effective use of non-current assets, the turnover of current assets and the changes in and profitability of revenues.
Table 1. Asset profitability in the crop growing sector for the period 2017 – 2021
| CROP GROWING | Amount (thousand BGN) | |||||
| 2017 | 2018 | 2019 | 2020 | 2021 | ||
| Net (balance) profit | 124176 | 118331 | 104209 | 122766 | 295415 | |
| Assets | 1494597 | 1578829 | 1685644 | 1706646 | 1917203 | |
| Non-current assets | 861769 | 906059 | 977329 | 992898 | 1040746 | |
| Current assets | 619005 | 656316 | 686463 | 695856 | 858706 | 21/17 |
| Return on Assets (ROA) | 8,31 | 7,49 | 6,18 | 7,19 | 15,41 | |
| Abs. change compared to the previous year | -0,81 | -1,31 | 1,01 | 8,22 | 7,10 | |
| Total Revenue | 895666 | 901036 | 919771 | 949983 | 1196802 | |
| Revenue Profitability | 13,86 | 13,13 | 11,33 | 12,92 | 24,68 | |
| Coefficient of the efficient use of non-current assets | 0,96 | 1,01 | 1,06 | 1,05 | 0,87 | |
| Coefficient of the turnover of the current assets | 0,69 | 0,73 | 0,75 | 0,73 | 0,72 | |
| Influence of the efficiency from the use of non-current assets | -0,14 | -0,16 | 0,14 | 0,87 | 0,57 | |
| Influence of the turnover of current assets | -0,18 | -0,07 | 0,05 | 0,08 | -0,15 | |
| Influence on the changes of revenue profitability | -0,50 | -1,08 | 0,82 | 7,27 | 6,67 | |
| Cumulative influence of the three factors | -0,81 | -1,31 | 1,01 | 8,22 | 7,10 | |
From the data in Table 1, it is inferable that there is a negative change in the return on assets during the first two periods (-0.81; -1,31), compared to the end of the period, when the values are positive and reach their highest levels in 2021 at 8,22 percentile points, i.e. for each 100 BGN of assets the balance profit has increased by 8,22 BGN. This increase is due to the following three factors:
– As a result of the efficient use of non-current assets, the return on assets has increased by 0,87 points.
– An acceleration of the turnover on current assets is observed, leading to an increase in the return on assets by 0,08 points.
– As a result of the growth of the revenue profitability, the return on assets has increased by 7,27 points.
When we summarized the data from the crop growing sector, we showcased that the change in economic profitability at the end of the studied period (2021) compared to the initial (2017) has led to an increase of 7,10 percentile points. This positive result was a consequence of the increased effective use of non-current assets by 0,57 points, the delay of the turnover of current assets by 0,15 points and the positive impact of the changes in revenue profitability, which resulted in an increase of 6,67 points.
Table 2. Return on assets in the livestock sector for the period 2017 – 2021
| LIVESTOCK FARMING | Amount (thousand BGN) | |||||
| 2017 | 2018 | 2019 | 2020 | 2021 | ||
| Net (balance) profit | 40629 | 29558 | 34399 | 31156 | 29230 | |
| Assets | 460659 | 484800 | 465557 | 469567 | 494101 | |
| Non-current assets | 219309 | 234403 | 231711 | 251970 | 275967 | |
| Current assets | 238803 | 247518 | 231331 | 214124 | 214392 | 21/17 |
| Return on Assets | 8,82 | 6,10 | 7,39 | 6,64 | 5,92 | |
| Abs. change compared to the previous year | -2,72 | 1,29 | -0,75 | -0,72 | -2,90 | |
| Total Revenue | 349395 | 361018 | 365255 | 363456 | 391201 | |
| Revenue Profitability | 11,63 | 8,19 | 9,42 | 8,57 | 7,47 | |
| Coefficient of the efficient use of non-current assets | 0,63 | 0,65 | 0,63 | 0,69 | 0,71 | |
| Coefficient of the turnover of the current assets | 0,68 | 0,69 | 0,63 | 0,59 | 0,55 | |
| Influence of the efficiency from the use of non-current assets | -0,09 | 0,11 | -0,29 | -0,01 | -0,45 | |
| Influence of the turnover of current assets | -0,01 | 0,26 | 0,24 | 0,22 | 0,90 | |
| Influence on the changes of revenue profitability | -2,61 | 0,93 | -0,71 | -0,92 | -3,36 | |
| Cumulative influence of the three factors | -2,72 | 1,29 | -0,75 | -0,72 | -2,90 | |
From the values in Table 2 it is notable that the change in economic profitability has a positive value only in 2019 and amounts to 1,29 percentile points. The other years mark negative values of this indicator, with a lowest point at the beginning of the studied period: -2,72. For 2021, the values of -0,72 percentile points were measured, meaning that per each 100 BGN of assets, the balance profit has been reduced by 0,72 BGN.
The positive result of 1,29 points in 2019 is a consequence of the impact of three factors:
– As a result of the effective use of the non-current assets, the return on assets has increased by 0,11 points.
– The acceleration of the turnover on the current assets has led to an increase of the return on assets by 0,26 points.
– As a result of the increase of revenue profitability, the return on assets has increased by 0,93 points.
The change in the return on assets in the livestock sector at the end of the studied period (2021) compared to the initial (2017) has marked a decrease of 2,90 percentile points. This decline is due to the inefficient use of non-current assets, which has led to a drop of 0,45 points, acceleration of the turnover of current assets, which has brought an increase of the economic profitability with 0.90 points and the negative impact of the changes in the revenue profitability, which resulted in a decrease of 3,36 points.
A key role in the financial analysis of the agricultural enterprises is played by the structural analysis, which can be used to determine the state, changes and dynamics of the main components on the asset side of balance sheet for the respective year or for a set period of time.
Due to the fact that the results obtained from the analysis of the structure, the assets in the crop growing and livestock farming sector have shown similar values, they had to be summarized in total for the entire agricultural sector.
After processing the initial data, we noticed an increase of the assets on the balance sheet by approximately 4% per each year versus the previous one, with the biggest growth in 2021, when the increase reached approximately 11%. The change at the end of the period compared to the beginning amounted to nearly 24%. This increase of the assets of the balance sheet was due mostly to the growth of the non-current assets by 12%, the increase of the current assets by 11% and the increase of the expenditures for future periods as part of the assets on the balance sheet by 1 %.
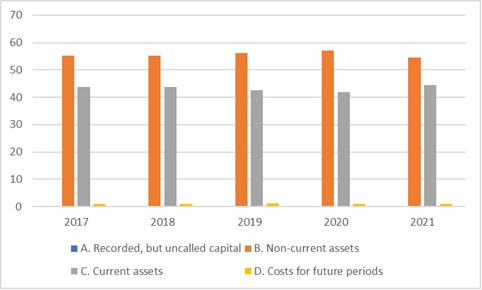
Figure 1. Structure of the assets on the balance sheet in the agricultural sector during the period 2017 – 2021
From the data illustrated in Fig. 1, it is apparent that the greatest relative share in the structure of the assets on the balance sheet is occupied by the non-current assets which during the studied period amounted to about 55%. They are followed by the current assets, which are approximately 44%, and last, the smallest relative share in the assets on the balance sheet belongs to the costs for future periods – 1%. Data for the recorded, but uncalled capital are unavailable for the agricultural sector over the studied period.
A considerable importance for the financial management in each enterprise is given to the analysis, evaluation and dynamics of assets. During the analysis of the main items in the asset side of the balance sheet, a greater absolute and relative increase of the non-current assets is observed in comparison to the increase of the current assets, which predisposes lower financial maneuverability. This is proven by the waning relative share of the current assets. The lack of uncalled capital has a positive aspect and is based on actual financial contributions.
- Conclusion
The challenges in the sector are related to creating sustainable agriculture through efficient production of agricultural produce, supporting innovations, improvement of the environment and preservation of the biodiversity. The solutions for tackling these global challenges are related to improving scientific research and innovation in this area. The investments and training of people employed in this activity are a key factor for more profitable agriculture.
The results from the change of return on assets under the influence of the studied factors in the crop growing industry increased, and at the end of the period they reached positive values. This increase to a great extent is due to the changes in revenue profitability.
The change in return on assets in the livestock sector had varying values, showing negative ones at the end of the period. They incurred as a result of the inefficient use of the non-current assets, as well as from the changes in the revenue profitability.
In a structural sense, it is apparent that non-current assets occupy the greatest relative share in the asset side of the balance sheet. The greater absolute increase of the non-current assets compared to the growth of current assets allows a reduced financial maneuverability.
REFERENCES
Chukov, K. (2003). Financial and Economic Analysis of the Enterprise. Trakia-M Publishing House.
Chukov, K. (2020). Rate of Return on production Assets: Methodology and Methods of Analysis. E-Journal: Institute of Certified Expert-Accountants, 25(3), 1 – 13. https://www.ides.bg/e-journal/2020/issue-3/03-2020-krastyo-chukov
Milev, O. (2023). Cost Recovery in the Agriculture. Trakia Journal of Sciences, 21(Suppl. 1), 167 – 171. https://doi.org/10.15547/tjs.2023.s.01.029
Ministry of Agriculture and Food. (2023). Agricultural report 2023: Annual report on the State and Development of Agriculture. https://www.mzh.government.bg/media/filer_public/2024/02/09/ad_2023_en.pdf
National Statistical Institute (NSI). (2024). Ceni na selskostopanskata produkcia po godini. NSI. https://www.nsi.bg/bg/content/843/цени-на-селскостопанската-продукция-по-години
National Statistical Institute (NSI). (2008). Classification of economic activities. https://www.nsi.bg/sites/default/files/files/publications/KID-2008.pdf
Petropoulos, D., Fotios, K., Biolcheva, P. & Valchev, E. (2023). Intelligent Animal Husbandry: Farmer Attitudes and a Roadmap for Implementation. Strategies for Policy in Science and Education, 31(3s), 104 – 116. https://doi.org/10.53656/str2023-3s-8-int
Terzieva, A. (2023). Application of the Cluster Approach in Cereal Production. In Proceedings of the Round Table “Industrial Business – Prospects and Opportunities” (pp. 81 – 88). Science and Economics Publishing House. https://ue-varna.bg/uploads/filemanager/303/publishing-complex/2023/Industrial-business-perspectives-opportunities-2023.pdf
Timchev, M. (1999). Financial and Economic Analysis. Trakia-M Publishing House.
Todorov, L. (2003). Profitability and Business Risk: Models and Methods of Analysis. Trakia-M Publishing House.
Veleva, S., Mondeshka, M. & Tsvetanova, A. (2023). Research of the Innovation Capacity of Agricultural Producers. Strategies for Policy in Science and Education, 31(6s), 138 – 150. https://doi.org/10.53656/str2023-6s-12-res

Свързани статии:
 HOW TO ALLOCATE LIMITED RESOURCES TO ACHIEVE MAXIMUM PROFIT IN A MANUFACTURING ORGANIZATION
SUSTAINABILITY EMBEDDEDNESS IN KEY CHARACTERISTICS OF PROCLAIMED ORGANIZATIONAL CULTURE
CHEMICAL TANKERS SAFETY CARGO HANDLING
RESEARCH OF THE INVESTMENT ACTIVITY IN THE ENTERPRISES OF THE “MANUFACTURING OF TEXTILE CLOTHING” SECTOR
HOW TO ALLOCATE LIMITED RESOURCES TO ACHIEVE MAXIMUM PROFIT IN A MANUFACTURING ORGANIZATION
SUSTAINABILITY EMBEDDEDNESS IN KEY CHARACTERISTICS OF PROCLAIMED ORGANIZATIONAL CULTURE
CHEMICAL TANKERS SAFETY CARGO HANDLING
RESEARCH OF THE INVESTMENT ACTIVITY IN THE ENTERPRISES OF THE “MANUFACTURING OF TEXTILE CLOTHING” SECTOR


